Alphabet Inc. (NASDAQ: GOOGL) is a $4.3 trillion company sitting 12.7% below its 52-week high, consolidating in a technically neutral zone while delivering some of the best financial results in its history. Revenue hit $403 billion in FY2025. Net income came in at $132 billion. EPS grew 34.6% year-over-year. So why isn’t the stock at all-time highs? We ran GOOGL through Ask The Desk to find out what the data actually says.
The Business: Still Compounding at Scale
Let’s start with the numbers that matter most. Alphabet has grown revenue from $37.9 billion in 2011 to $403 billion in FY2025 — a 15-year CAGR of approximately 18.4%. That kind of sustained growth at this scale is almost unprecedented in corporate history.
FY2025 was particularly strong:
| Metric | FY2025 | FY2024 | Change |
|---|---|---|---|
| Revenue | $403.0B | $350.0B | +15.1% |
| Net Income | $132.2B | $100.1B | +32.1% |
| Net Margin | 32.8% | 28.6% | +420bps |
| EPS (Diluted) | $10.81 | $8.04 | +34.6% |
The margin expansion story is particularly notable. Alphabet’s FY2025 net margin of 32.8% is among the highest in the company’s history, reflecting the payoff from the 2022-2023 restructuring — where the company cut headcount aggressively and reset its cost base — combined with continued operating leverage as revenue scaled.
Return on equity of 31.8%, return on assets of 22.2%, and ROIC of 21.8% confirm this is not a business that is getting worse. It is getting better.
The Balance Sheet: Fortress Class
Despite aggressive capital deployment, Alphabet’s balance sheet remains exceptional:
- Cash and short-term investments: $126.8B
- Total debt: $59.3B — largely investment-grade bonds issued to fund AI infrastructure
- Debt-to-equity: 0.14 — near-zero financial leverage
- Current ratio: 2.01 — healthy liquidity
- Altman Z-Score: 16.73 — deep in the safe zone; no financial distress risk of any kind
The company issued $32.1B in new debt in FY2025, not because it needed the money — it has $126.8B in cash — but to fund AI infrastructure at scale while preserving flexibility. This is capital allocation sophistication, not distress.
The AI CapEx Question — The Only Real Debate
Here is where the bull and bear cases diverge sharply.
In FY2025, Alphabet spent $91.4 billion in capital expenditure — up from $52.5 billion in FY2024. That’s a 74% increase in a single year, and it represents 22.7% of revenue, up from 15.0% the prior year. The result: operating cash flow of $164.7 billion, but free cash flow of only $73.3 billion after capex — essentially flat year-over-year despite massive earnings growth.
The bull case: this spend is building the infrastructure layer for the next decade of AI-driven revenue across Google Search, Google Cloud, YouTube, and Waymo. Every dollar of capex today is a competitive moat being constructed.
The bear case: $91.4B in capex is an enormous bet on AI monetization that hasn’t fully arrived yet. If AI-native competitors like ChatGPT and Perplexity erode Search market share faster than Cloud AI revenue ramps, the FCF compression could persist longer than the market expects.
The P/FCF of 58.8x reflects this tension — it’s elevated precisely because FCF is being suppressed by the capex cycle, not because the underlying business is weak.
Valuation — Reasonable for the Growth Rate
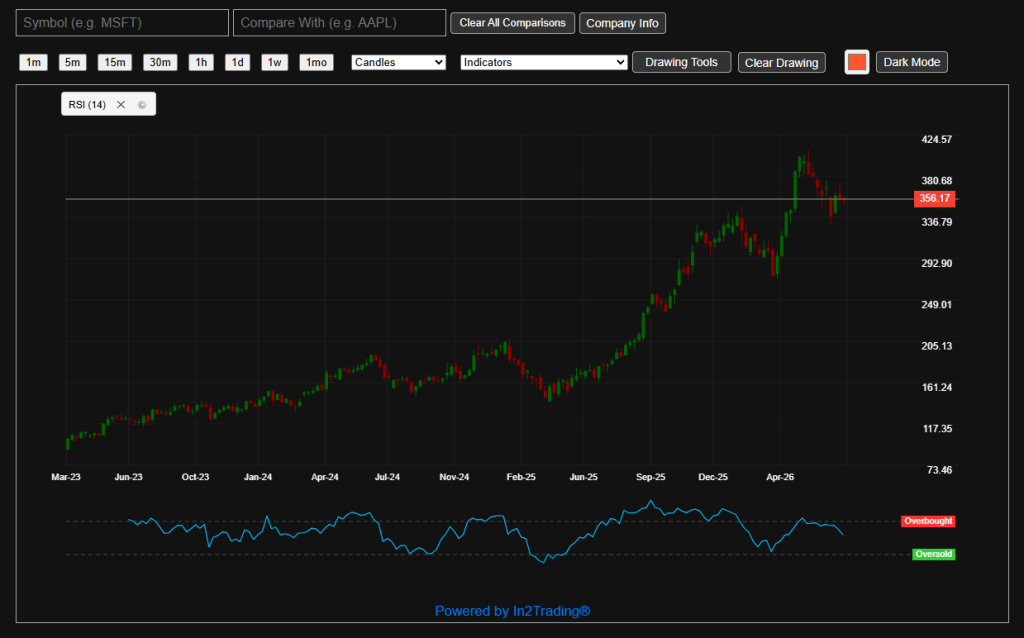
At $356.36, here’s how GOOGL is priced:
| Metric | Value | Assessment |
|---|---|---|
| P/E (Trailing) | 28.7x | Attractive for 34% EPS growth |
| EV/EBITDA | 24.1x | Fair |
| Price/Sales | 10.7x | Premium but justified |
| Price/FCF | 58.8x | Elevated — CapEx distortion |
| Rule of 40 Score | 47.9 | Strong — above the 40 threshold |
The most important number here is the PEG relationship: a 28.7x P/E on 34% EPS growth means GOOGL is trading at less than 1x PEG — historically a signal of undervaluation for a compounder of this quality. The elevated P/FCF is a capex story, not a business quality story.
The stock sits 12.7% below its 52-week high of $408.61 and 97.5% above its 52-week low of $180.48 — firmly in the upper half of its annual range but not extended.
Technical Setup — Consolidation, Not Breakdown
The technical picture is neutral with improving momentum signals:
Structure:
- Below 50-day SMA ($372.22) — near-term bearish
- Well above 200-day SMA ($319.96) — long-term uptrend intact
- Golden cross active — 50-SMA above 200-SMA, structurally bullish
Momentum:
- RSI (14): 46.81 — neutral, room to move either direction
- MACD histogram: +0.54 — turning positive, early momentum improvement signal
- Stochastic K/D: 60.4/58.38 — neutral
- Williams %R: -39.6 — neutral, not overbought
Key Levels:
| Level | Price | Significance |
|---|---|---|
| 52-Week High | $408.61 | Full recovery target |
| 50-day SMA | $372.22 | Key resistance |
| Upper Bollinger | $376.03 | Resistance zone |
| Current Price | $356.36 | — |
| 20-day VWAP | $353.39 | Near-term support |
| Lower Bollinger | $338.86 | Support zone |
| 200-day SMA | $319.96 | Major long-term support |
One caution flag worth noting: OBV (on-balance volume) is declining, suggesting distribution pressure at current levels — larger participants may be selling into strength. This is the primary reason the stock hasn’t pushed through resistance despite strong fundamentals.
A close above $372–$376 on strong volume would be the technical signal that the consolidation is over and the next leg higher has begun.
The Risk Factors — What Could Go Wrong
Three legitimate risks worth monitoring:
1. Search Disruption — AI-native search alternatives (ChatGPT, Perplexity) are growing rapidly. Google Search is an $175B+ annual revenue business. Even modest market share erosion would be a significant headwind.
2. Regulatory Overhang — DOJ antitrust actions targeting Search and advertising practices remain unresolved. A forced structural remedy (breaking up the ad tech stack, for example) would be a material negative.
3. CapEx Returns — $91.4B in capex is a massive bet. If AI Cloud revenue doesn’t accelerate meaningfully in FY2026-2027, the market will reprice the stock on suppressed FCF rather than earnings.
Bull vs. Bear — The 12-Month Scenarios
Bull Case:
- AI Cloud revenue accelerates, capex cycle peaks in FY2025-2026
- FCF normalizes toward $100B+ as capex intensity moderates
- Stock re-rates toward prior high of $408+ as execution is demonstrated
- P/E expansion toward 33-35x on continued EPS growth
Bear Case:
- Search market share erosion accelerates faster than Cloud AI ramp
- Capex stays elevated through FY2027, keeping FCF suppressed
- Regulatory action creates structural uncertainty
- Stock retests $320 (200-day SMA) on risk-off rotation
The Verdict
Alphabet is one of the highest-quality businesses on the planet, and at 28.7x earnings on 34% EPS growth, the valuation is arguably the most attractive it has been relative to growth in years. The balance sheet is a fortress. The operating leverage is real. The compounding history over 15 years is undeniable.
The one legitimate debate is the AI capex cycle — $91.4B is a number that requires faith in future monetization. That faith is either rewarded with a stock back above $400, or tested if AI revenue ramps slower than expected.
For long-term investors, the current consolidation between $338 and $376 looks like an accumulation zone, not a breakdown. The technical trigger to watch: a sustained close above $372 confirms the consolidation is resolving to the upside.
This analysis was researched using Ask The Desk, In2Trading’s AI-powered stock analysis platform. Ask The Desk delivers institutional-quality fundamental and technical analysis on any ticker in seconds — built for self-directed investors who want real data, not headlines.
Financial disclaimer: This article is for informational purposes only and does not constitute investment advice. Always conduct your own due diligence before making any investment decisions.