This Starbucks stock analysis examines one of the most compelling turnaround stories in the market right now — and uses it to teach one of the most important concepts in technical analysis: support and resistance.The stock collapsed to a 52-week low of $77.99 in early November 2025, then rallied nearly 40% to a high of $108.88 in May 2026 as CEO Brian Niccol’s reset began showing results. Today it sits at $98.76 — caught in the middle, consolidating below round-number resistance and above long-term support.
That makes SBUX a perfect real-world case study for one of the most important concepts in technical analysis: support and resistance. In this post, we’ll explain what these levels are, why they matter, and then map out exactly where they sit on the Starbucks chart — using real market data and analysis from our AI research platform, Ask The Desk.

The stock has recovered sharply off its late-2025 lows but is now consolidating below $100. SBUX weekly chart provided by In2Trading.
Starbucks Stock Analysis: The Turnaround in Progress
Before the chart, the story. We asked Ask The Desk for a full breakdown of Starbucks, and the fundamental picture it returned is a classic “early-stage turnaround” profile:
FY2025 was ugly. Revenue grew just 2.8% to $37.2B while net income fell by half to $1.86B, with EPS dropping to $1.63 from $3.31 a year earlier. Operating margin compressed to 9.6% — the sharpest margin contraction in over a decade — as Niccol poured money into store labor, simplified menus, and restructuring.
But the inflection may be starting. After three consecutive quarterly EPS misses through FY2025, Starbucks delivered a beat in its most recent quarter ($0.50 actual vs. $0.43 expected). One beat doesn’t make a trend, but it’s the first concrete evidence that the turnaround spending is translating into results. The next earnings report lands on August 4, 2026, with consensus at $0.65 — a second consecutive beat would be a major signal.
There are real risks in the data too. Ask The Desk flagged a dividend payout ratio of 149% (dividends currently exceed earnings), $26.6B in total debt, and a P/E of 52.6x that only makes sense if earnings recover. Wall Street’s average price target sits at $110.27, roughly 11.6% above the current price — so analysts are betting the recovery continues, but the margin of safety is thin.
This is exactly the kind of setup where knowing your levels matters most. So let’s talk about what support and resistance actually are.
What Are Support and Resistance? (A 3-Minute Lesson)
Support is a price area where a falling stock has historically stopped falling. Think of it as a floor: every time price drops into that zone, buyers step in with enough demand to absorb the selling and push the price back up.
Resistance is the opposite — a ceiling. It’s a price area where a rising stock has historically stalled, because sellers (profit-takers, trapped buyers from higher prices, short sellers) overwhelm demand.
Why do these levels exist? Three big reasons:
1. Market memory. Traders remember prices. If thousands of people bought SBUX near $93 and watched it rally, many of them will buy again if it returns there. If others bought at $108 and watched it fall, many will sell with relief when price gets back to their break-even. Past transactions create future behavior.
2. Round numbers and psychology. Humans anchor to clean numbers. $100 is a magnet for orders — limit buys, limit sells, stop losses — simply because it’s $100. That’s why SBUX stalling just under $100 right now is no coincidence.
3. Moving averages act as dynamic support and resistance. Widely-followed indicators like the 50-day and 200-day simple moving averages (SMAs) become self-fulfilling levels, because so many traders and algorithms key off them. When price approaches a major moving average, expect a reaction.
Two more rules worth memorizing:
- Levels are zones, not exact prices. Support isn’t $93.00 to the penny — it’s a region, like $93–95. Give levels room to breathe.
- Broken support becomes resistance, and vice versa. When a floor breaks, it often flips into a ceiling on the next rally (and broken ceilings become floors). This “role reversal” is one of the most reliable patterns in charting.
Now let’s apply all of this to Starbucks.
SBUX: The Key Levels Right Now
Here’s the technical map Ask The Desk generated for SBUX at $98.76:
| Level | Price | Why It Matters |
|---|---|---|
| Resistance 1 | $100–101 | Round-number psychology + the 20-day ($100.88) and 50-day ($99.66) SMA cluster sitting directly overhead |
| Resistance 2 | $106–109 | The May 2026 swing highs, capped by the 52-week high at $108.88 |
| Support 1 | $93–95 | Prior consolidation zone — heavy market memory from months of trading here |
| Support 2 | $91.39 | The 200-day SMA — the classic long-term trend line institutions watch |
| Support 3 | $77.99 | The 52-week low — the floor of the entire recovery |
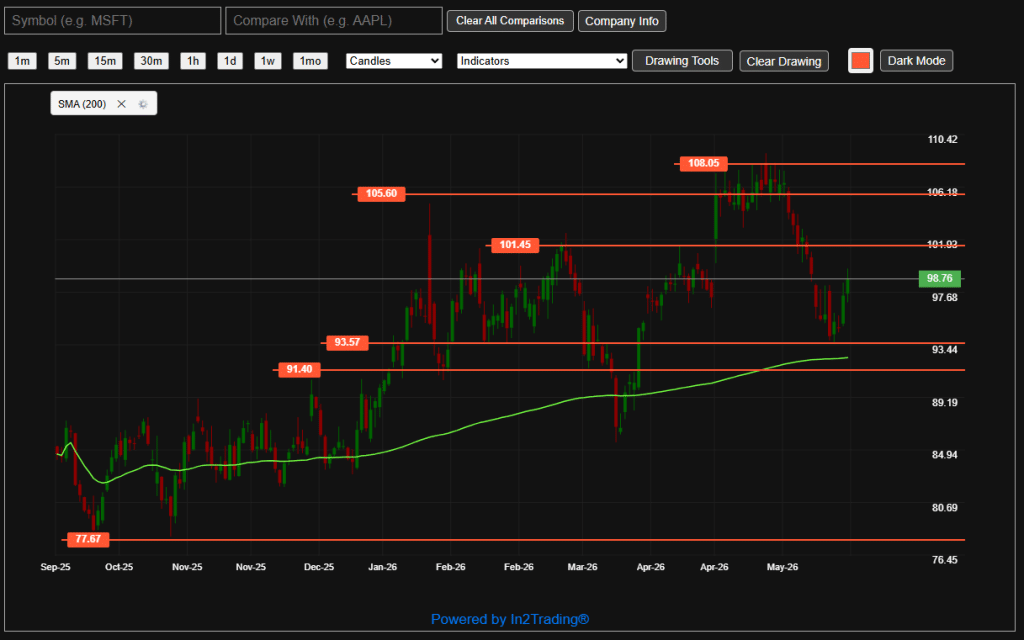
The key zones on the SBUX chart: resistance at $100–101 and $106–109, support at $93–95 and the 200-day moving average.
Notice how the textbook concepts show up in real life here:
- The $100–101 resistance is a perfect example of round-number psychology and dynamic resistance stacking on top of each other. Price is below both the 20-day and 50-day SMAs, which are converging right at the $100 level. A decisive close above that cluster would be the first technically constructive signal.
- The $93–95 support zone is pure market memory — SBUX spent months consolidating in this region, building up a base of buyers who will likely defend it.
- The 200-day SMA near $91 is the line in the sand. Ask The Desk notes the “golden cross” (50-day SMA above the 200-day) remains intact — a medium-term bullish structure. As long as price holds above the 200-day, the recovery trend is alive. A break below it would change the conversation entirely.
What the Indicators Add
Levels tell you where to pay attention; momentum indicators tell you how price is behaving as it approaches them. From Ask The Desk’s technical readout:
- RSI at 47 — dead neutral. No overbought or oversold extreme.
- MACD slightly negative — mild bearish momentum during this pullback.
- OBV (On-Balance Volume) falling — this is the one to watch. Falling OBV suggests distribution (net selling pressure) hasn’t fully resolved. A turn higher in OBV while price holds the $93–95 zone would be a strong sign accumulation has resumed.
In plain English: SBUX is in a neutral, corrective pause inside a larger recovery. The bulls control the bigger picture (golden cross, price above the 200-day); the bears control the short term (price below the 20/50-day cluster, soft volume).
The Bull and Bear Case in One Glance
Ask The Desk summarized both sides:
Bull case: The Q2 earnings beat is early proof the turnaround is working. If same-store sales inflect positive in the second half of FY2026 and margins recover, the analyst target of $110+ is reachable — and a breakout above $109 would put the stock at new 52-week highs.
Bear case: At 52.6x trailing earnings, there’s no room for the recovery to stall. The 149% dividend payout ratio is unsustainable without an earnings rebound, and a dividend cut would likely trigger institutional selling. A loss of the $91 level (200-day SMA) would be the technical confirmation of that scenario.
Catalysts to watch: the August 4 earnings report, same-store sales prints in the US and China, and any announcement on Starbucks’ international restructuring.
How to Actually Use These Levels
Whether you’re bullish or bearish on Starbucks, the levels give you a framework instead of a guess:
- Above $101 (a confirmed close over the SMA cluster) → short-term momentum flips back to the bulls; $106–109 becomes the next test.
- Between $95 and $100 → no-man’s-land. This is where chasing trades gets expensive. Patience is a position.
- A test of $93–95 that holds → the highest-probability spot for bulls to look for evidence of buyers (watch for OBV turning up).
- A weekly close below $91 → structural damage. The recovery thesis needs to be re-examined, with $78 as the ultimate downside reference.
That’s the entire point of support and resistance: it doesn’t predict the future, it tells you in advance which prices will prove or disprove your thesis — so you can plan your decisions before the market forces them.
Run Your Own Analysis
This Starbucks stock analysis — every fundamental, technical level, and bull/bear breakdown — came from a single conversation with Ask The Desk, our AI-powered financial research assistant. Ask it about any stock, ETF, or crypto in plain English and get institutional-grade analysis in seconds, backed by live market data.
Want to map the levels yourself? Our charting platform gives you candlestick charts, moving averages, and drawing tools to mark your own support and resistance zones — just like the charts in this post.
Disclaimer: This article is for informational and educational purposes only and does not constitute financial, investment, or trading advice. Stock prices and data referenced were accurate as of June 10, 2026 and may have changed. Investing involves risk, including the possible loss of principal. Always do your own research or consult a licensed financial advisor before making investment decisions.